
 hammad

An API can return a success code and still give users the wrong result. The best API monitoring tools check whether requests work as expected, then help your team spot failures quickly. Here are seven options, with the work each one fits best.
1. Checkly: API checks managed as code
Checkly lets engineering teams manage production checks as code. Its TypeScript and CLI workflow fits teams that want API monitoring to live beside application code, move through Git review, and run as part of CI/CD.
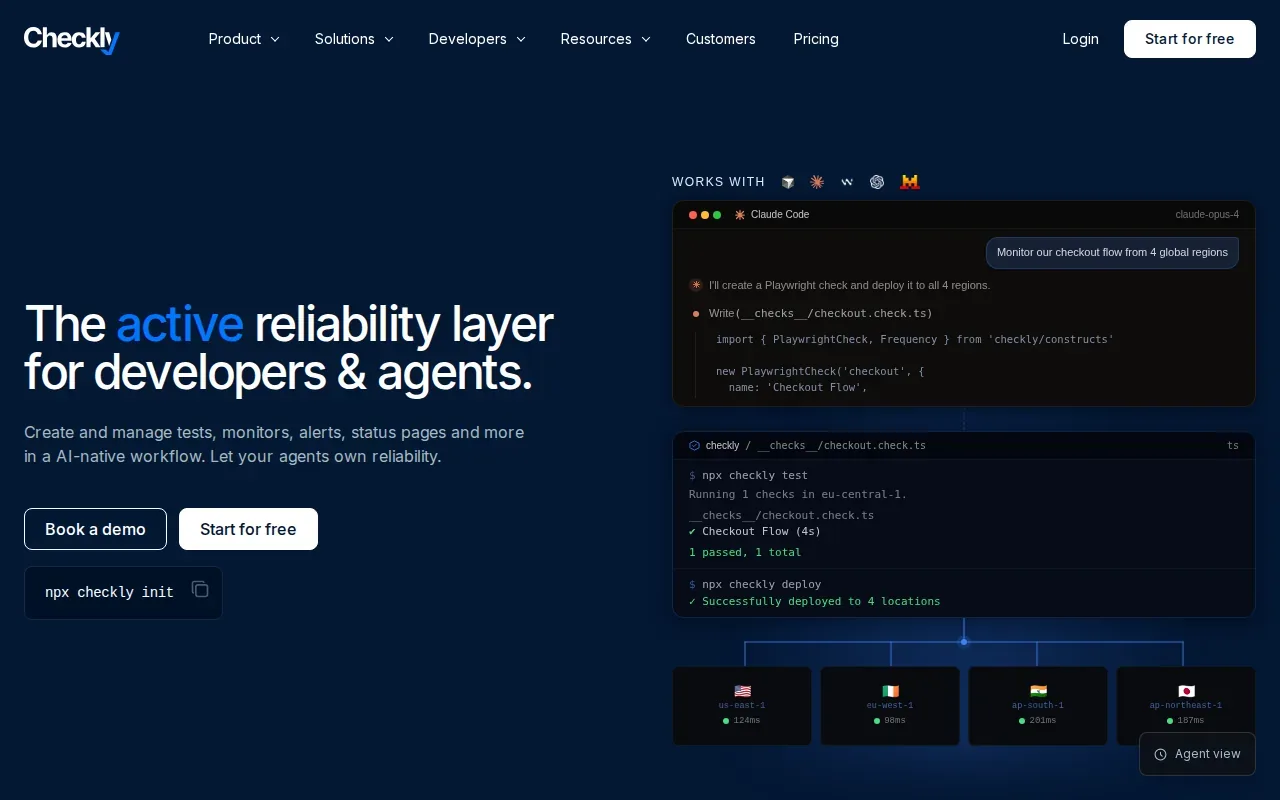
That code-first setup is useful when a service changes often. A developer can update a check in the same pull request as an endpoint change, review it with the rest of the code, then deploy it through the team’s usual pipeline. Checkly supports Playwright browser checks as well, so a team can monitor an API call alongside the user journey that depends on it.
Checks can cover more than a single request. Checkly supports multi-step checks and token login, which helps test flows that need authentication before making later calls. That makes it a fit for teams testing a production workflow such as signing in, creating a record, then checking that the record can be read back.
Monitoring as code also helps keep configuration traceable. Checkly supports Git-based version control for monitoring checks. If you’re also comparing tools for pre-release test runs, Nexaura Techs has a separate roundup of best API testing tools.
Checkly’s verified alerting methods include SMS and phone calls. The verified integrations include Git and CI/CD. If your team already reviews TypeScript changes in pull requests, this model can keep monitor changes in the same workflow rather than a separate manual setup.
2. Moesif: API analytics and usage monitoring
Moesif is an API analytics and monitoring platform for teams that ship APIs as a product. It suits teams that need to see how customers use endpoints, where users hit friction, and how usage relates to monetization.
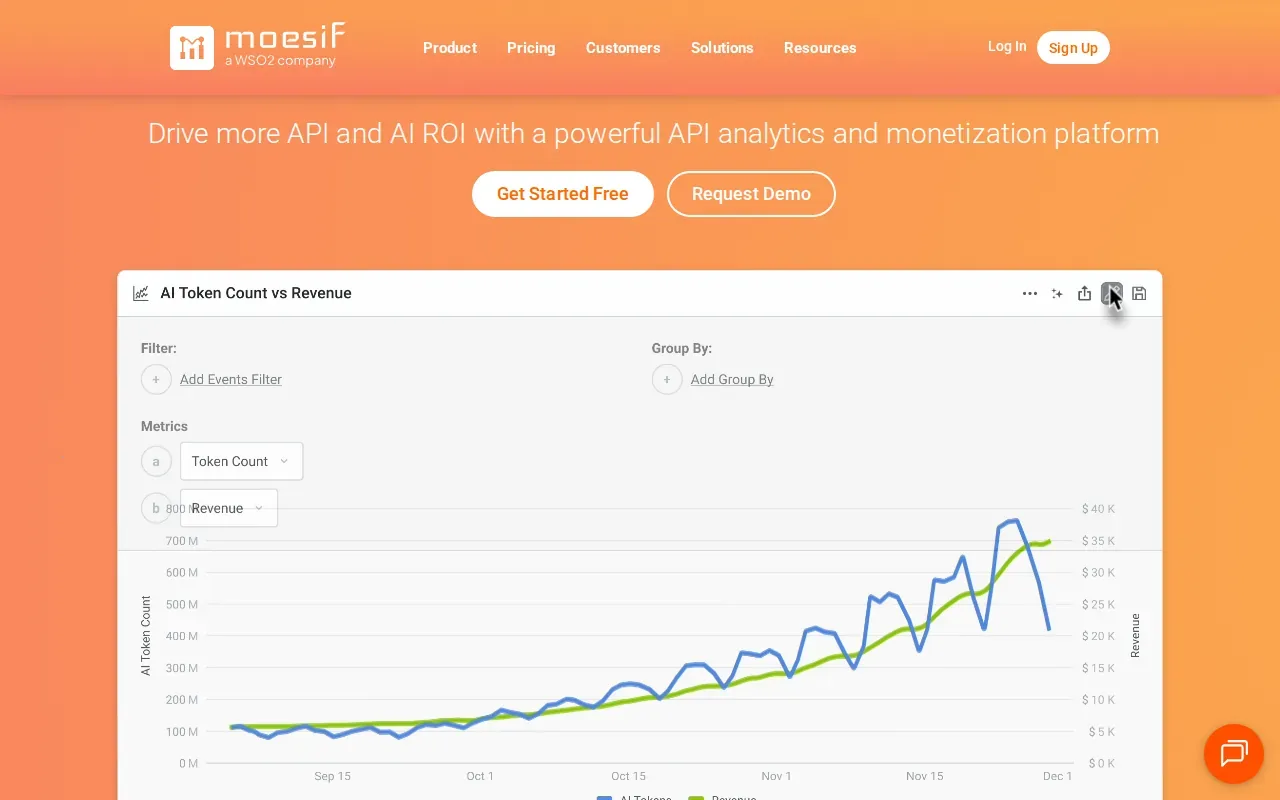
Traditional uptime checks answer a narrow question: did the request succeed from the monitoring location? Moesif focuses on API activity tied to actual usage. Its analytics and usage monitoring can help a product team spot a change in endpoint use or find an endpoint where customers encounter friction.
That distinction matters when a service is technically up but customers struggle to finish a task. For example, if a customer repeatedly calls an endpoint without completing a workflow, usage patterns may give the team a reason to investigate the API experience. Moesif includes endpoint friction detection.
Moesif also connects usage insights with usage-based monetization. Teams can use those insights when shaping how API access is priced or packaged. This makes it a more natural fit for an API product team than for a team that only wants a basic uptime ping.
The free plan follows a 14-day trial and includes Growth plan features plus 10 million events. That event allowance gives teams a way to try usage monitoring at meaningful volume, but it doesn’t replace the need to decide which customer and product questions matter most. Start with a few key endpoints and events, then build views around decisions the team needs to make.
Pick Moesif when product usage is part of the monitoring question. For a small list of endpoints where the main concern is availability, a simpler check may be easier to operate.
3. Hyperping: API checks with on-call and status pages
Hyperping combines HTTP and API checks with on-call schedules, escalation, incident creation, and status pages. It’s aimed at small SaaS teams and startups that want an alert path and customer-facing incident updates in the same service.
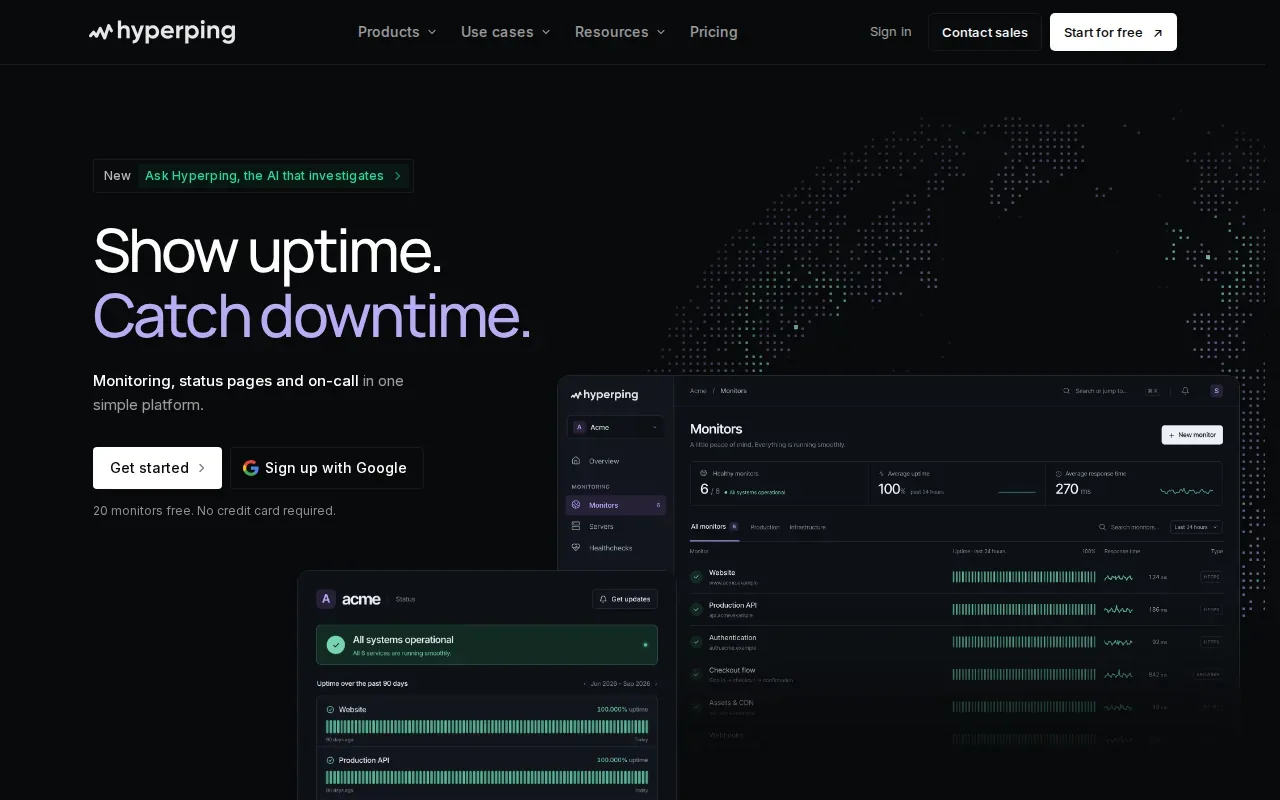
For a basic API monitor, teams can check response status and body text. Body matching helps catch a response that returns a success code but lacks the text expected from a healthy service. A latency threshold can also flag a response that takes too long for the service’s needs.
Here is the key operational difference: the check is only the start. Hyperping’s on-call schedules and escalation can route a confirmed issue to the right responder, while incident creation gives the team a place to track the event. A status page can then share service state with customers instead of leaving support teams to answer every outage question one by one.
The free plan includes 20 monitors. The verified feature set also includes Playwright browser checks, so a team can add a user-flow check alongside API checks as its monitoring needs grow. This may suit a small team that wants a straightforward place to manage alert ownership and service updates.
Monitoring can create noise when a single failed request triggers an incident. Set body text and latency expectations carefully. The check should fail when users would notice a problem, not whenever a harmless response detail changes.
Choose Hyperping if your team wants API checks tied directly to on-call and public status updates. If those incident workflows already live elsewhere, compare the monitoring features you need before adding another place to manage them.
4. Site24x7: REST API uptime and response validation
Site24x7 monitors REST API uptime and response time, then checks whether the response data is correct. It suits teams that need to validate API content or test a sequence of calls from more than one location.
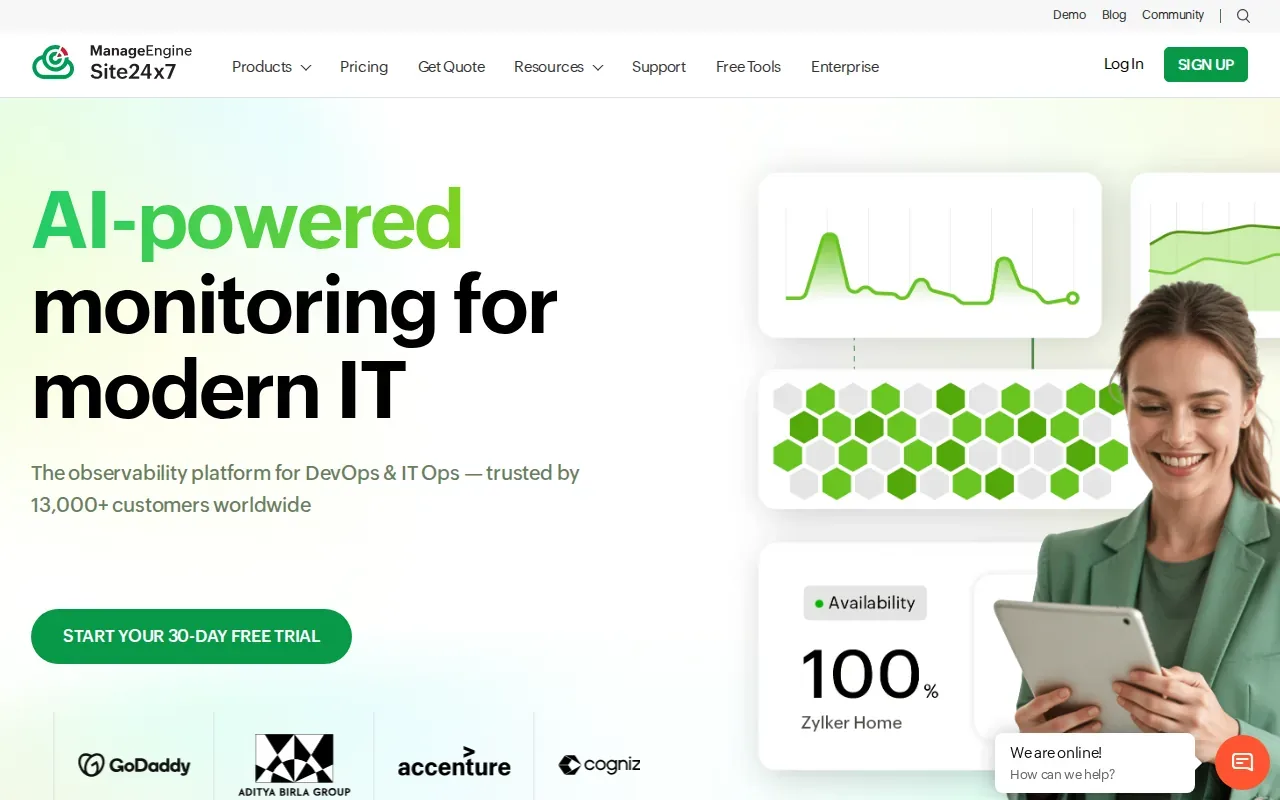
A status code is useful, but it doesn’t prove that the response contains the data an application needs. Response validation adds a separate check for expected JSON, XML, or text content.
Site24x7 supports multi-step transaction checks with up to 25 API requests in a test. That lets a team model a workflow where one request supplies data for the next. It can be useful for a mobile app flow that first authenticates, then fetches account details or submits a transaction.
Authentication support includes Basic, NTLM, OAuth2, and client certificates. The 130+ monitoring locations can help teams check availability and response times across regions. For a production service, regional results can help distinguish a broad outage from a problem that appears only for users near one location.
Site24x7 also lists alerting destinations such as ServiceNow, PagerDuty, Jira, Slack, Microsoft Teams, AWS, Azure, and Kubernetes. A free plan is available. The main decision is whether your team needs response validation and chained requests, not only a basic ping.
For services that depend on API keys, monitoring checks should use credentials carefully and match the authentication flow clients use. A separate guide to automating API key rotation can help teams think through key changes alongside monitor setup.
5. Better Stack: Uptime monitoring with logs and incident management
Better Stack combines uptime monitoring with logs, traces, and incident management. It is a fit for teams that want operational signals and incident response together, without heavy configuration.
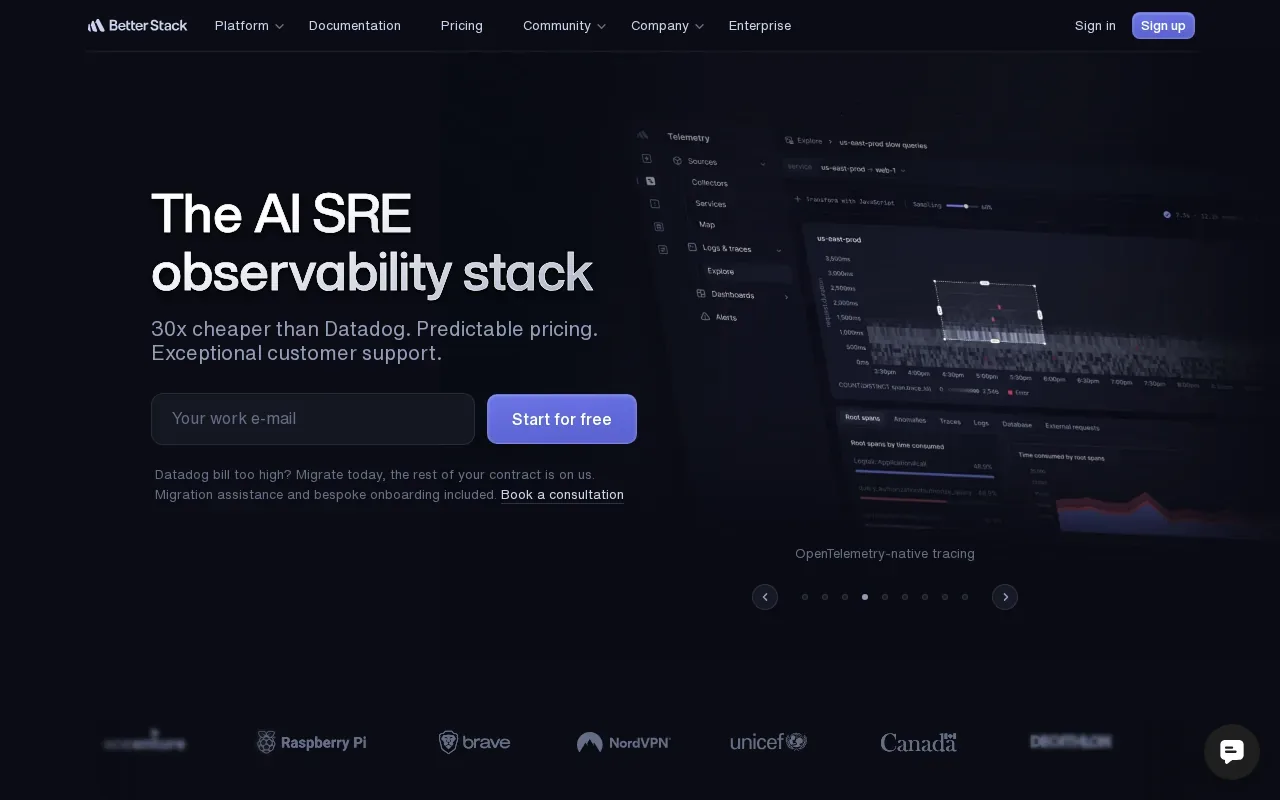
An uptime monitor can tell you that an endpoint failed. Logs and traces can help show what happened around the failure. Keeping those signals in one platform may help responders move from an alert to the service activity behind it without switching among separate monitoring tools.
Think about a checkout API that starts returning errors after a deployment. The uptime check surfaces the failure, while logs and traces can help narrow the problem to a request path or service behavior. Incident management gives the team a place to coordinate response. This is the kind of workflow where a unified view can save tool switching, though the value depends on which signals your team already collects.
Better Stack’s free tier covers personal projects at $0. For a team, the relevant question is whether combining uptime checks with logs and traces matches its current operating model. If the team already has a mature log and trace setup, compare how much duplication a new platform would add.
Better Stack is less about a single specialized API assertion and more about connecting monitoring to response work. Teams that want API analytics centered on customer usage may prefer Moesif. Teams that need uptime information alongside operational logs and incident management should consider Better Stack.
For a wider view of infrastructure health, API checks can sit beside server checks. A roundup of server monitoring tools covers that adjacent layer, which can help when an API failure may stem from the host rather than the endpoint logic.
6. Uptrends: Regional checks and chained API requests
Uptrends can monitor a single API request or a chain of requests. Its regional API workflow checks suit teams that need to test authentication, dependencies, or a multi-call path.
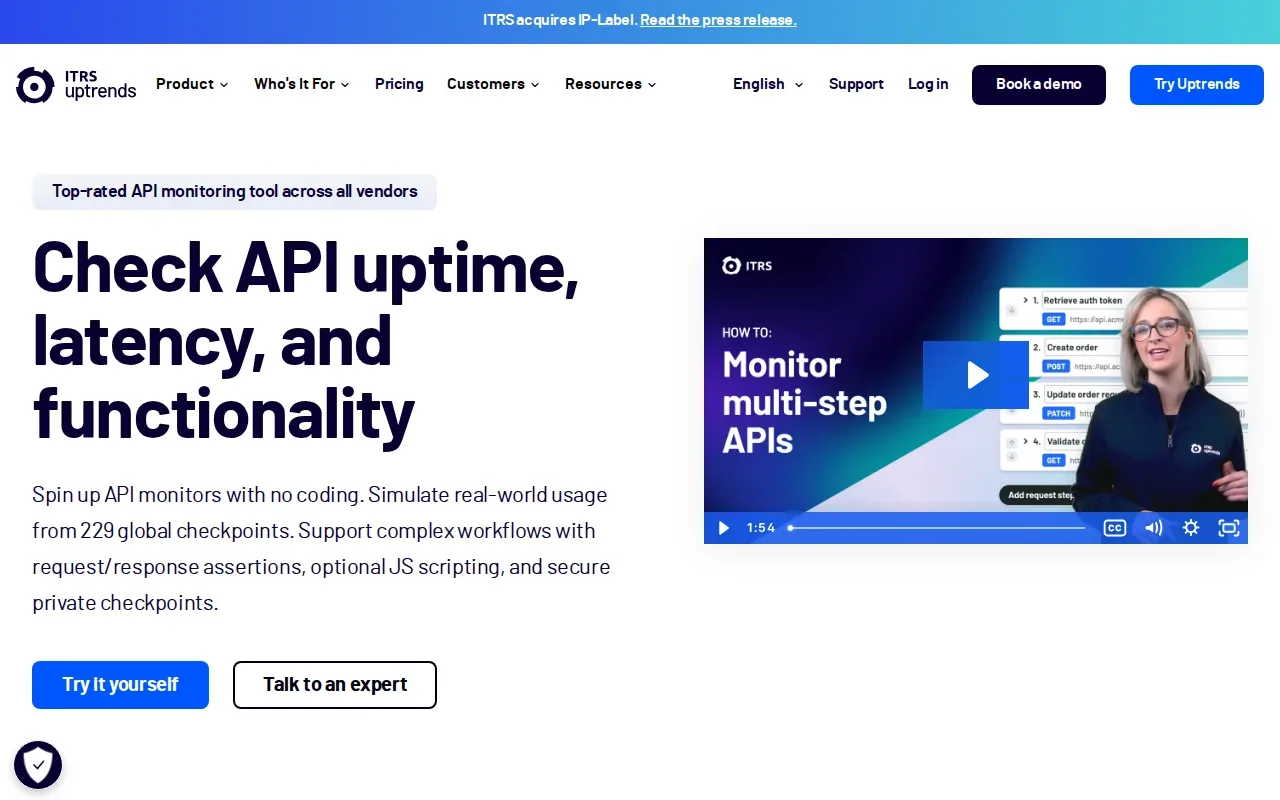
A chained check can follow the same broad sequence as an API client. One call can authenticate, a later call can use the returned value, and another can validate the result. This is more useful than checking each endpoint alone when a service only works after requests happen in the right order.
Uptrends supports request and response assertions, optional JavaScript scripting, and authentication and dependency checks. The Pro plan runs checks every minute. Terraform support can help teams manage monitoring as part of infrastructure changes, while private locations on Enterprise can place checks inside a network.
Regional checks help reveal differences in availability or response time across locations. That can matter when a service relies on regional systems or when customer traffic comes from more than one part of the world. A single successful check from one location does not tell the whole story.
Uptrends provides a 30-day free trial. The verified best-fit description is teams that want a fixed monthly price for a set number of API endpoints. Before committing, map each multi-step request to the workflow you want to protect. Each HTTP request in a chain counts as an API credit, so the size of the flow affects how monitoring use is measured.
Uptrends is a strong candidate when regional checks and chained requests are both part of the requirement. If you only need a handful of single-request checks, compare that workflow against a simpler monitor before building a larger test suite.
Infrastructure-as-code practices can also make monitors easier to review during deployments. Nexaura Techs covers other developer tooling in its comparison of software development tools for teams, including tools used across coding and cloud work.
7. UptimeRobot: Straightforward HTTP and API checks with a free plan
UptimeRobot offers straightforward HTTP and API checks with a free plan. Its verified free allowance is 50 monitors at five-minute intervals, making it a usable starting point for a small set of endpoints.
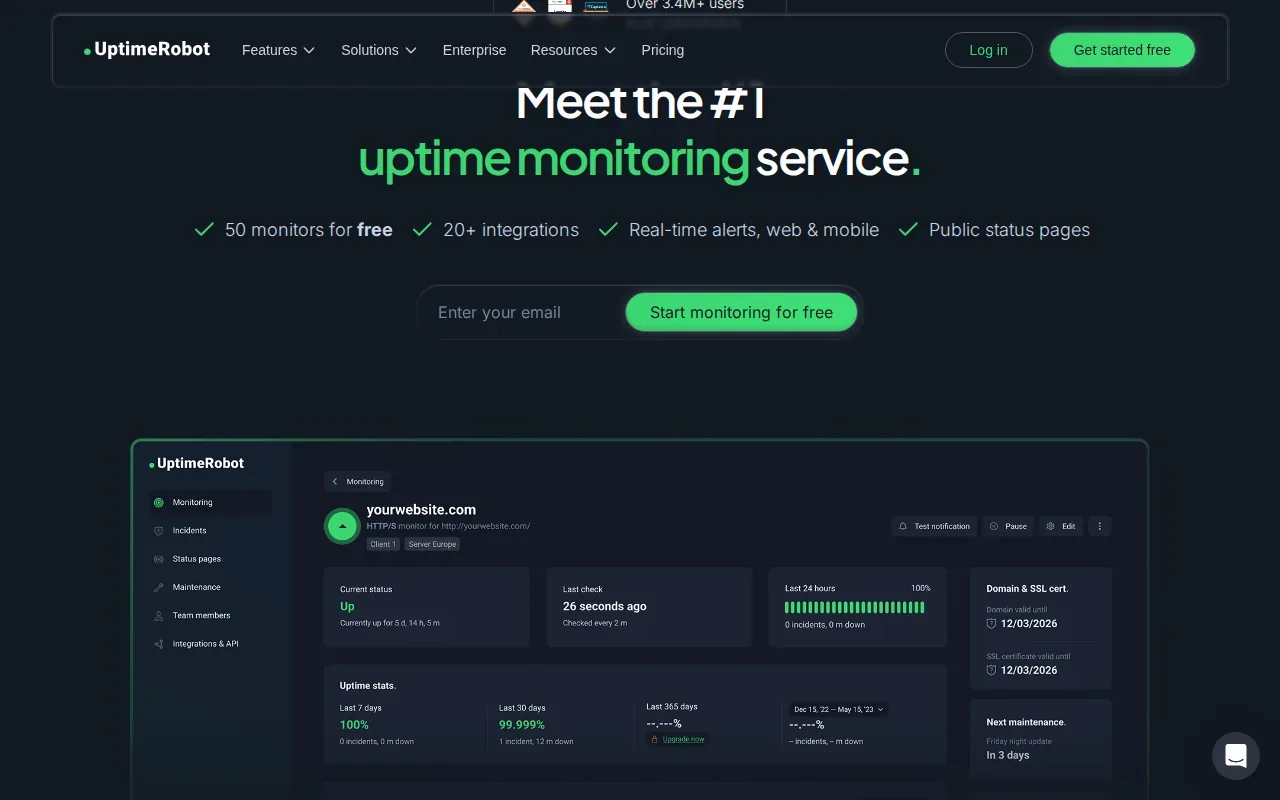
The core fit is simple: monitor an endpoint, receive an email notification, and review weekly summaries. For a side project or a small service, that may be enough to learn when an endpoint stops responding without setting up a larger incident workflow.
UptimeRobot also has a REST API that can create, edit, or delete monitors. Teams can use that API to manage monitors through a CI/CD workflow rather than configuring every check by hand. This makes the tool more useful to developers who want basic uptime checks managed alongside deployment work.
| Decision point | UptimeRobot fit | Good match when |
|---|---|---|
| Monitor count | 50 on the free plan | You want to cover several endpoints without starting with a paid tier. |
| Check frequency | Five-minute intervals on the free plan | A short delay in detecting an outage is acceptable. |
| Notifications | Email is enough for the people who own the service. | |
| Automation | REST API for monitor changes | You want to create or update checks through code. |
The table points to the trade-off: the free plan gives room for multiple monitors, while its five-minute interval may not suit endpoints that need faster detection. Check the expected time to notice an outage against the service’s user impact before relying on it as the only alert path.
If a simple health check is the goal, UptimeRobot keeps the setup focused. If the check must validate response content or manage an on-call escalation, choose a tool whose listed features match that need.
Frequently Asked Questions
What do API monitoring tools check?
API monitoring tools check whether an endpoint responds and whether its response meets expected conditions. Depending on the tool, those checks can cover response time, status codes, body content, authentication, or a chain of API calls. Some tools also track API usage or connect failures to logs and incident response.
What metrics should I monitor for an API?
Start with availability, response time, and error rate. Add throughput when you need to understand request volume, and watch resource use when infrastructure limits may affect service. For a user-facing workflow, also check whether the response contains the data or text the client expects. A successful status code alone may not confirm that the workflow worked.
Are free API monitoring tools enough?
Free plans can be enough for early coverage or personal projects, but their limits vary. UptimeRobot’s free plan includes 50 monitors at five-minute intervals. Hyperping includes 20 monitors on its free plan, while Moesif’s free plan follows a 14-day trial and includes 10 million events with Growth features. Match the limits to your alerting needs.
What’s the difference between API testing and API monitoring?
API testing checks behavior during development or a test run. API monitoring repeats checks over time, often against live services, so teams can detect changes or outages after deployment. Testing can prove that a planned case passes in a test environment. Monitoring can show that a production endpoint continues to respond as expected.
Can API monitors run in CI/CD?
Yes. Checkly supports TypeScript and CLI-based monitoring managed through Git and CI/CD. UptimeRobot’s REST API can create, edit, or delete monitors, which teams can include in deployment automation. Choose a code-based workflow when monitor changes should be reviewed and shipped with application changes.
Conclusion
Choose Checkly if you want reviewed, code-managed production checks; choose Moesif for API product usage insight, or UptimeRobot for simple checks across many endpoints. Start by adding one monitor for a user-critical API path, then verify that its failure reaches the person who can act. Nexaura Techs can help you compare developer tools and keep up through its free weekly newsletter.